
Search for Indicators
Healthy Eating Dashboard
Ensuring access to healthy affordable food and existing resources
Diets high in vegetables, fruits, whole grains, and lean proteins can help maintain a healthy weight and avoid chronic diseases such as diabetes, cancer, and heart disease.
| See all focus areas |
Healthy Eating Recipe Blog
- Want to try something new tonight? Check out our Public Health Recipe blog here.
Senior Center Community Garden
- The Placerville Senior Center started a community garden in the courtyard at the Senior Center at 937 Spring Street in September 2017! Click here to learn more.
Indicator Gauge Icon Legend
Legend Colors
Red is bad, green is good, blue is not statistically different/neutral.
Compared to Distribution
 the value is in the best half of communities.
 the value is in the 2nd worst quarter of communities.
 the value is in the worst quarter of communities.
Compared to Target
 meets target;
  does not meet target.
Compared to a Single Value
 lower than the comparison value;
 higher than the comparison value;
 not statistically different from comparison value.
Trend

 non-significant change over time;
 significant change over time;
  no change over time.
Compared to Prior Value
 higher than the previous measurement period;
 lower than the previous measurement period;
 no statistically different change from previous measurement period.
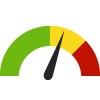
Child Food Insecurity Rate
Value
Compared to:
Child Food Insecurity Rate County: El Dorado
Child Food Insecurity Rate County: El Dorado
8.5%
(2021)
Compared to:
CA Counties
The distribution is based on data from 58 California counties.
U.S. Counties
The distribution is based on data from 3,140 U.S. counties and county equivalents.
CA Value
(13.5%)
The regional value is compared to the California state value.
US Value
(12.8%)
The regional value is compared to the national value.
Prior Value
(10.4%)
Prior Value compares a measured value with the previously measured value. Confidence intervals were not taken into account in determining the direction of the comparison.
Trend
This comparison measures the indicator’s values over multiple time periods.<br>The Mann-Kendall Test for Statistical Significance is used to evaluate the trend<br>over 4 to 10 periods of measure, subject to data availability and comparability.
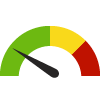
Food Insecurity Rate
Value
Compared to:
Food Insecurity Rate County: El Dorado
Food Insecurity Rate County: El Dorado
8.0%
(2021)
Compared to:
CA Counties
The distribution is based on data from 58 California counties.
U.S. Counties
The distribution is based on data from 3,140 U.S. counties and county equivalents.
CA Value
(10.5%)
The regional value is compared to the California state value.
US Value
(10.4%)
The regional value is compared to the national value.
Prior Value
(9.5%)
Prior Value compares a measured value with the previously measured value. Confidence intervals were not taken into account in determining the direction of the comparison.
Trend
This comparison measures the indicator’s values over multiple time periods.<br>The Mann-Kendall Test for Statistical Significance is used to evaluate the trend<br>over 4 to 10 periods of measure, subject to data availability and comparability.
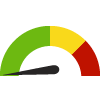
Students Eligible for the Free Lunch Program
Value
Compared to:
Students Eligible for the Free Lunch Program County: El Dorado
Students Eligible for the Free Lunch Program County: El Dorado
27.9%
(2022-2023)
Compared to:


CA Counties
The distribution is based on data from 58 California counties.
U.S. Counties
The distribution is based on data from 2,710 U.S. counties and county equivalents.
CA Value
(52.6%)
The regional value is compared to the California state value.
US Value
(42.8%)
The regional value is compared to the national value.
Prior Value
(25.8%)
Prior Value compares a measured value with the previously measured value. Confidence intervals were not taken into account in determining the direction of the comparison.
Trend
This comparison measures the indicator’s values over multiple time periods.<br>The Mann-Kendall Test for Statistical Significance is used to evaluate the trend<br>over 4 to 10 periods of measure, subject to data availability and comparability.
